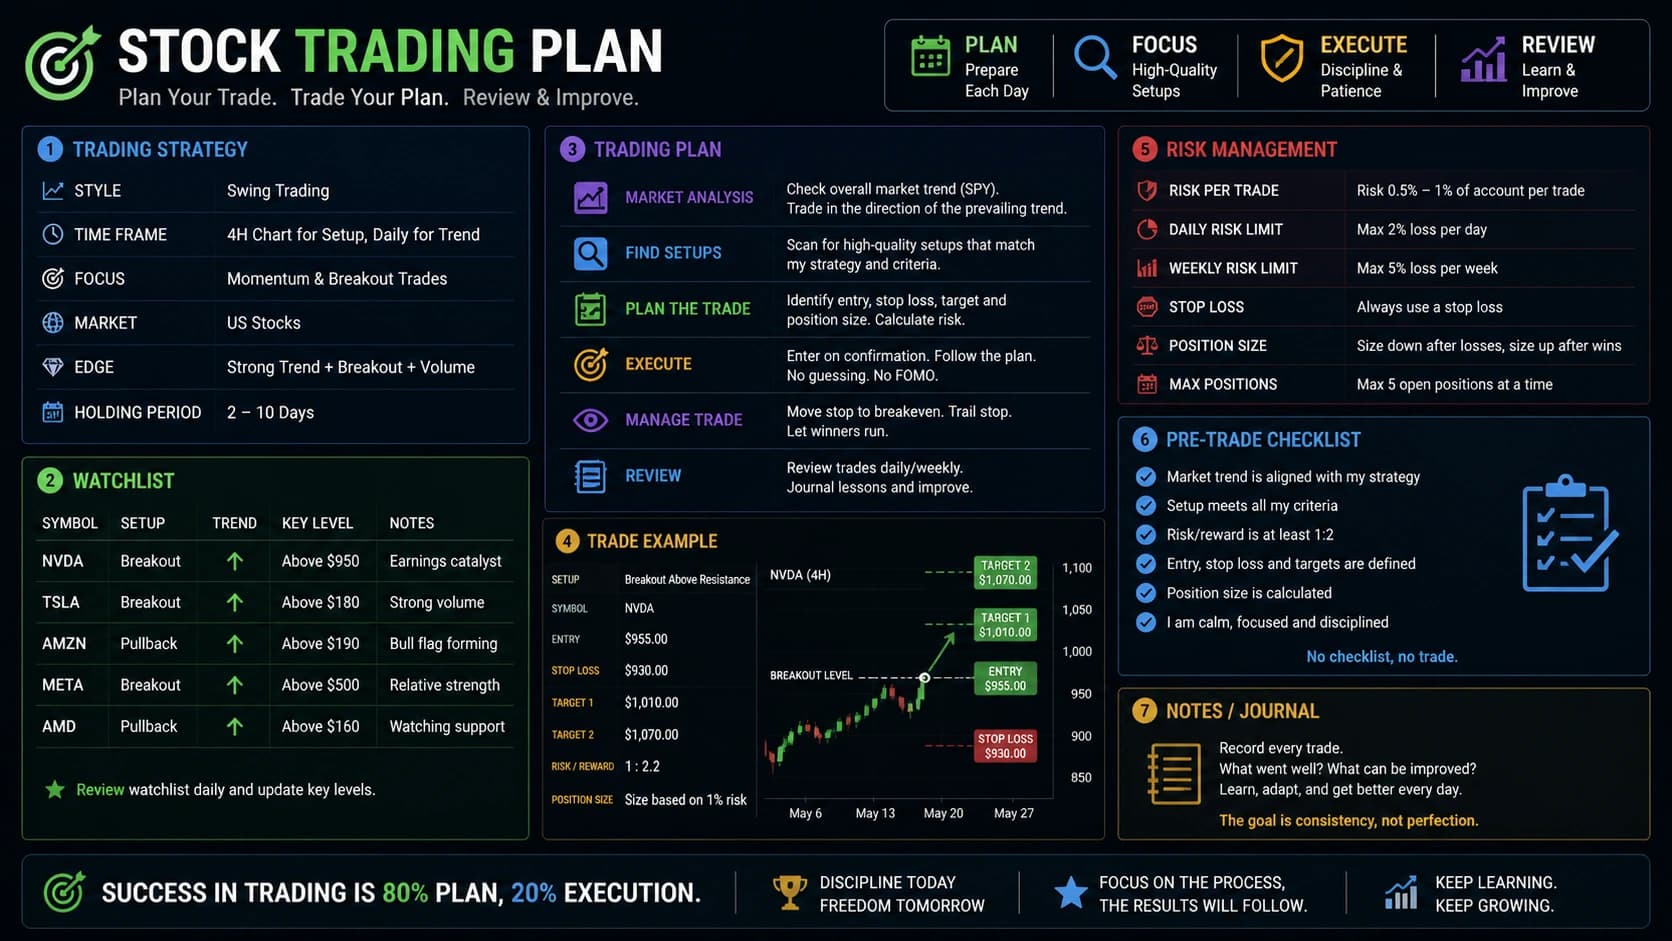
MSFT Microsoft Corporation - Trade Plan — 2026-05-15
Full run of trading-os (`/decide MSFT`) on 2026-05-15
TL;DR
LONG MSFT, conviction 2/5 — a deliberately small, catalyst-dependent expression of the research verdict, not a chase. The chart is damaged (bouncing_in_downtrend, MACD histogram negative, price stalling into the 427-434 supply cluster) and there is no clean new-entry setup today, so the entry is scaled across three pullback limits — 421.02 / 411.41 / 405.11 — blended ~412.51, rather than buying the stall at 424. Hard stop at 398.01 below the 402-405 dual-confirmed support cluster; first target 433.70 at the top of the swing-high cluster (~1.5:1 R:R on the full position). Size is 4.13% NAV (100 shares, ~,251) risking 0.145% NAV (~,450) — the min-of-methods number, then haircut by one third because the memory note flags MSFT as a correlated sibling of the live AMZ.US OVERWEIGHT. Horizon 42 trading days, deliberately stopping short of the July 29 earnings binary.
Source verdict
LONG — conviction 2 / 5.
"This is a LONG at conviction 2 — a deliberately small, catalyst-dependent directional view, not a high-conviction buy. ... The verdict is LONG because the evidence — an income-multiple discount, contracted backlog, positive full-year revisions, bullish positioning — points one direction; the low conviction reflects that the entry timing is poor and the first-call cap applies."
—
research-verdict.md, decision and TL;DR
The decision (LONG) and conviction (2) are inputs. This plan decides only how to express the long, not whether.
Direction & instrument
LONG the common stock (MSFT). No instrument substitution.
- The verdict is LONG, not HEDGED — no put overlay or pair short is mandated, and conviction 2 does not justify the extra cost/complexity of a structured hedge.
- Options were considered and rejected as the primary instrument.
options-flow.mdflags IV at the 79th percentile (ELEVATED) and a persistent -2.2pp call skew, which makes outright call buying expensive. More importantly, a long-option structure forces a view on timing that conviction 2 does not support. Equity is the honest expression of a low-conviction, slow-thesis long. - The bullish options positioning (PCR-V 0.22, 13 call strikes of opening UOA) is noted as a supporting signal for direction — it is not a reason to use options here.
Entry
- Method: scaled (1/3 / 1/3 / 1/3 limit ladder)
- Blended price: 412.51
- Validity: GTC, but the whole ladder is cancelled and the plan re-evaluated on a daily close above 433.70 (see below)
| Tranche | Shares | Limit price | Basis |
|---|---|---|---|
| 1 | 33 | 421.02 | Swing low 2026-01-29 — first defensive level |
| 2 | 33 | 411.41 | Swing low 2026-04-23 — post-tariff-shock low |
| 3 | 34 | 405.11 | Swing low 2026-05-06 — recent floor / top of HVN zone |
Rationale: the technical-analyst explicitly states "no long entries are
warranted" at the current 424.21 print and suggested_entry is null.
The constructive re-entry the chart actually wants — a daily close above
433.70 on >1.5x volume with MACD turning positive — does not exist today.
Buying the stall into overhead supply at 424 would be chasing. A scaled
ladder into the support shelf below converts "poor timing" into "patient
accumulation": each tranche fills only on a pullback to a real swing
level, giving a better cost basis and a tighter, better-justified stop.
This is a deliberate, documented override of "buy now": the override is toward patience, not aggression. If price simply grinds sideways or breaks out above 434 without ever pulling back, tranches 2 and 3 (and possibly all three) never fill — that is an acceptable outcome. A partial fill is a smaller position, consistent with conviction 2; an unfilled ladder means the constructive-breakout re-entry case (below) takes over.
Breakout alternative: if MSFT closes above 433.70 on >1.5x 50-day volume with the MACD histogram positive before the ladder fills, cancel the unfilled ladder and re-evaluate for a fresh entry near 434-436 with a stop ~413 — the technical-analyst's documented constructive scenario. That is a new plan, not this one; it would be a separate, re-sized ticket.
Stop
- Price: 398.01
- Type: hard stop
- Justification: Snapped to the swing low of 2026-04-30 (398.01),
sitting just below the highest-quality support on the chart — the
402-405 zone, which is triple-confirmed (volume-profile HVN at 402.09,
lower Bollinger Band at 402.02, and the formula-derived 2-ATR level).
Placing the stop below that cluster rather than inside it avoids being
shaken out by a noise wick into support.
- Noise check: from the blended entry of 412.51 the stop is 14.50 points away. Daily ATR(14) is 11.06, so 1σ daily move ≈ 11.06. The stop sits at ~1.31 ATR — slightly below the 1.5σ guideline. This is accepted because the entry is scaled: the worst-case full-position cost basis is tranche 1 at 421.02, against which the stop is 23.01 points / ~2.08 ATR — comfortably outside noise. The blended figure understates the true cushion. If only tranche 1 fills, the stop is a wide 2.08 ATR; if all three fill, the lower tranches mean the average cost is genuinely near 412.51 and 1.31 ATR is acceptable for a level that is a structural break, not a wiggle.
- Drawdown check: a stop-out at 398.01 from the blended entry is a -3.52% position loss, i.e. 0.145% of NAV — well inside the 1% single- trade-loss cap and inside any plausible risk-committee drawdown view. The position is not too big for this stop.
- A daily close below 402 is the technical-analyst's own regime-flip-to-downtrend trigger; the 398.01 stop is the operational expression of that — it sits one noise-band below the line that invalidates the chart.
Targets
- First (TP1): 433.70 — the top of the dense 427-434 swing-high cluster (four swing highs Apr 17 - May 7) and coincident with the upper Bollinger Band (433.02). This is the first genuine overhead obstacle, a level the chart structurally points to, not a number picked for comfort. Reward:risk from the blended entry = (433.70 - 412.51) / (412.51 - 398.01) = 21.19 / 14.50 ≈ 1.46:1. Modest, honestly so — that is what a low-conviction long into overhead supply offers, and it is well inside the "no wishful >3:1" guardrail.
- Second (TP2): 455.00 — the lower edge of the 455-465 region, which
is where the 200-day SMA (463.14) sits and the technical-analyst names
as the next meaningful overhead zone once 434 is cleared. There is no
chart pattern (technical-analyst calls
pattern: null), so TP2 is the next major resistance, not a measured-move projection. Reward:risk to TP2 ≈ (455.00 - 412.51) / 14.50 ≈ 2.93:1. TP2 is only live if MSFT first closes convincingly above 434 — absent that breakout, 433.70 is the effective ceiling and TP1 is the realistic exit. - Trail rule: on a daily close above 433.70, raise the stop to breakeven (blended cost basis, ~412.51). After TP1 is tagged, sell half the position and trail the remainder with a stop at 421.02 (the former tranche-1 level, now support-turned-floor) targeting TP2.
Horizon
42 trading days (~2 calendar months), to roughly 2026-07-15.
Catalyst-calendar overlay: the single binary that the entire thesis
depends on is Q4 FY2026 earnings on 2026-07-29 (research-verdict.md
what-to-watch; news.md 13-quarter earnings-day-decline pattern). The
default 21-day horizon is too short for an unscheduled re-rating thesis;
the 63-day quarter horizon would run straight through the earnings gap.
42 days is the deliberate compromise: long enough to give the patient
accumulation thesis room to work, but stopping ~10 trading days short of
the print. This plan does not carry the position into the earnings gap.
The intent at horizon is a clean, pre-earnings decision — exit, or
explicitly re-underwrite a separate earnings-hold ticket — not a passive
roll into the binary. See "What I'm explicitly not doing."
Size
sizing:
  method_used: min_of_methods
  size_pct: 4.13
  shares: 100
  notional: 41251
  risk_dollars: 1450
  risk_pct_nav: 0.145
  conviction: 2
  nav_basis: 1000000          # research-mode default NAV
  blended_entry: 412.51
  rationale: >
    Conviction 2 sets fixed-fractional risk at 0.25% NAV (per the
    position-sizing conviction schedule). Fixed-fractional with a 14.50-pt
    blended-entry stop distance gives 7.11% NAV / 172 shares. Vol-targeted
    (0.20% NAV per 1-sigma daily move, HV20 30.6%) gives 10.38% NAV. Kelly
    is undefined: the skill provides no p_win below conviction 3, so no
    Kelly term is computed. Took the min of the two defined methods
    (7.11%), then applied a one-third correlation haircut to 4.74% because
    the memory note flags MSFT as a correlated sibling of the live AMZ.US
    OVERWEIGHT and instructs that the two be sized as one mega-cap-tech
    exposure. Rounded down to the round-lot floor of 100 shares = 4.13%
    NAV. Single-trade risk is 0.145% NAV, comfortably inside the 1% cap.
  alternatives:
    fixed_fractional_pct: 7.11
    vol_targeted_pct: 10.38
    kelly_quarter_pct: null      # undefined below conviction 3
    parity_pct: null
  caps_checked:
    single_position: 10.0        # 4.13 <= 10.0 OK
    single_loss: 1.0             # 0.145 <= 1.0 OK
    sector: 35.0                 # MSFT + AMZ.US mega-cap tech, ~7.6% combined, OK
    correlation: 25.0            # 0.75 corr x (3.5% AMZ + 4.13% MSFT) ~ 5.7% <= 25 OK
    liquidity: 1_day             # MSFT mega-cap, 100 shares clears trivially
Sizing notes. The methods disagree by a wide margin (7.1% vs 10.4%); that is expected and the min-rule applies — there is no conviction-5 override that would switch to the median. The binding constraint is not a hard cap but the correlation haircut: the memory note is explicit that a simultaneous MSFT long and AMZ.US OVERWEIGHT is "one correlated exposure, not two independent calls." The one-third trim is the operational expression of that instruction. The round-lot floor of 100 shares then takes the final figure to 4.13% — slightly above the post-haircut 4.74% target only because 100 is the minimum tradeable round lot; the next lot (200 shares) would be 8.25%, well over the haircut budget, so 100 stands.
Partial-fill outcomes: if only tranche 1 fills, the position is 33 shares / 1.39% NAV; if tranches 1-2 fill, 66 shares / ~2.72% NAV. These smaller sizes are acceptable and consistent with conviction 2.
Critical assumptions
- Azure growth holds in the low-to-mid 30s on the July 29 print and does not slide below 30% — the explicit bull/bear flip point.
- FY26 annual estimate-revision breadth stays net-positive (+0.40 ERB does not flip negative) through the horizon.
- Operating margin holds at or above 45%; no two consecutive quarters of YoY compression.
- The 402-405 support shelf holds as a structural floor — the scaled entry assumes pullbacks into this zone are buyable, not the start of a fresh leg down toward the March low (356.28).
- The income-multiple discount (24.2x TTM, 21.5x forward vs 30.6x/26.7x peer) is genuine mispricing, not a permanent regulatory/capex risk premium.
- AMZ.US remains the only other correlated mega-cap-tech long; if a third is added, the combined exposure must be re-checked against the correlation cap before this position is increased.
Thesis-invalidating events
These trigger an immediate exit regardless of price — the stop catches price invalidation; these catch event invalidation:
- FY26 annual ERB flips from +0.40 to net-negative in any revision cycle — direct invalidation per the research verdict.
- Azure guidance cut below ~30% at any interim communication, or any pre-announcement / negative guide ahead of July 29.
- UK CMA probe escalates from a slow overhang into a near-term structural remedy, or converges with coordinated EU action (watch the ~July 1 milestone).
- A material hyperscaler-capex retrenchment signal — MSFT itself, or any of META/AMZN/GOOGL, guiding AI/cloud capex down, which would undercut the demand backdrop the re-rating thesis rests on.
- HYG / credit spreads gap wider — MSFT's +3.09 HYG beta means a sharp spread-widening (HYG down >3-4% fast) is a macro invalidation independent of anything MSFT-specific; reassess the position immediately if it occurs.
- A daily close below 402 — the technical-analyst's regime-flip-to- downtrend trigger; this would normally be caught by the 398.01 stop, but if it happens on a gap that skips the stop, exit at the open.
What I'm explicitly not doing
- Not buying the 424 stall. No new-entry setup exists today; chasing into the 427-434 supply cluster is what the technical-analyst explicitly warns against. The plan waits for pullbacks to real support instead.
- Not carrying the position through July 29 earnings. The 42-day horizon stops ~10 trading days short of the print. MSFT has a 13-quarter earnings-day-decline pattern; this is a poorly-timed, pre-catalyst long, not an earnings bet. At horizon the position is exited or re-underwritten as a separate, explicitly-sized earnings-hold ticket — it is not rolled passively into the binary.
- Not using options. IV at the 79th percentile and a -2.2pp call skew make debit option structures expensive, and conviction 2 does not support a timing-sensitive structure. Equity only.
- Not sizing to the fixed-fractional or vol-targeted number. Both (7.1% / 10.4%) are deliberately overridden down to 4.13% by the correlation haircut — the AMZ.US overlap is treated as real, not ignored. Letting the risk committee push back from an oversized starting point would defeat the protocol; the starting point is already honest.